Friday 28th August 2009
MKY Corporation Limited (MKY)
Clickable Image

Volume: 3,525,000
No. of Trades: 26
Opening Price: 0.018
High Price: 0.020
Low Price: 0.018
Closed at 0.020 Up 11.11%
Clickable Chart
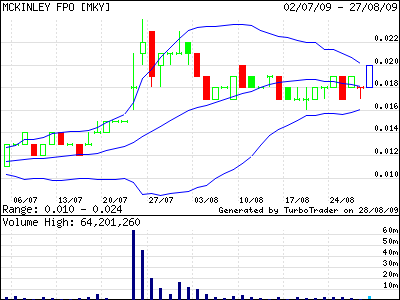
Charting Analysis Overview Of MKY's Current Trading
# Dragonfly Doji
Click Chart To Enlarge
Chart Below Showing Cross-Over of
Buyers~~~~ over Sellers~~~~~

__________________________________________
Thursday 27th August 2009
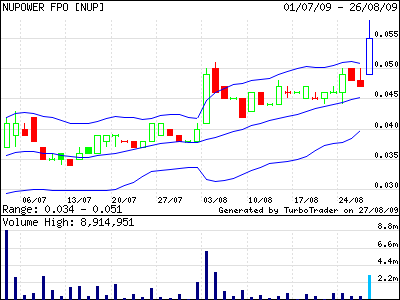
Nupower Resources Limited (NUP)
Clickable Image

Volume: 3,081,057
No. of Trades: 45
Opening Price: 0.049
High Price: 0.058
Low Price: 0.049
Closed at 0.055 Up 17.02%
Clickable Image
Nupower Resources Limited (NUP)
Clickable Image
Volume: 3,081,057
No. of Trades: 45
Opening Price: 0.049
High Price: 0.058
Low Price: 0.049
Closed at 0.055 Up 17.02%
Clickable Image
Charting Analysis Overview Of NUP's Current Trading
# Rising Volume for 2 days
# Closed outside top Bollinger
Click Chart To Enlarge

___________________________________________________
Wednesday 26th August 2009
Greenland Minerals Limited (GGG)
Clickable Image

Volume: 4,028,375
No. of Trades: 21
Opening Price: 0.42
High Price: 0.50
Low Price: 0.42
Closed at 0.50 Up 26.58%
Clickable Image
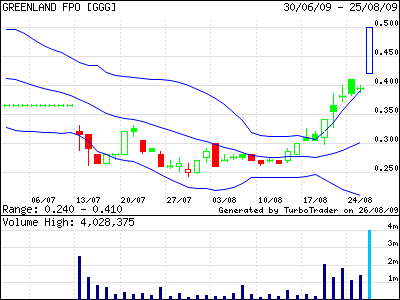
Charting Analysis Overview Of GGG's Current Trading
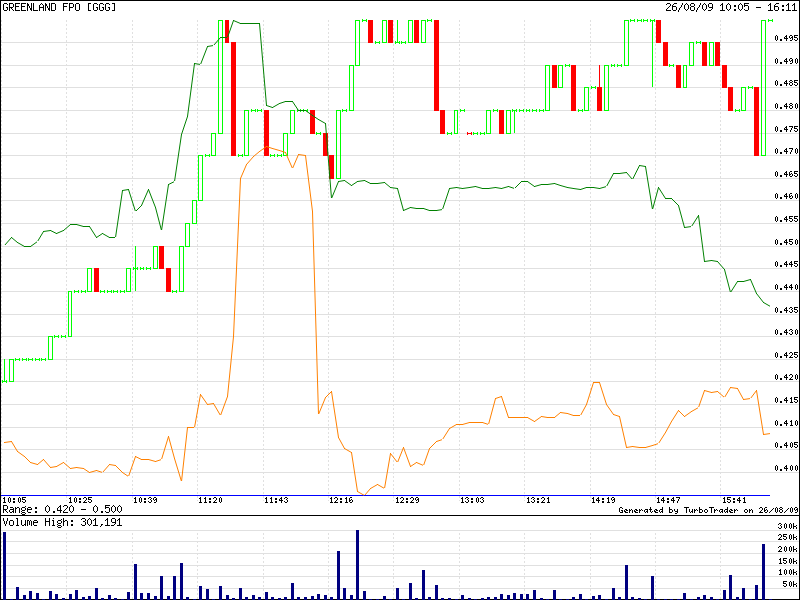
Greenland Minerals Limited (GGG)
Clickable Image
Volume: 4,028,375
No. of Trades: 21
Opening Price: 0.42
High Price: 0.50
Low Price: 0.42
Closed at 0.50 Up 26.58%
Clickable Image
Charting Analysis Overview Of GGG's Current Trading
# Rising Volume for 2 days
# Above 4x ADV
# Closed outside top Bollinger for 5 days
# Gapped Up
# Above 4x ADV
# Closed outside top Bollinger for 5 days
# Gapped Up
Click Chart To Enlarge
Chart Below Showing Cross-Over of
Buyers~~~~ over Sellers~~~~~
________________________________________
Tuesday 25th August 2009
Bannerman Resources Limited(BMN)
Clickable Image

Volume: 1.260,991
No. of Trades: 405
Opening Price: 1.115
High Price: 1.23
Low Price: 1.115
Closed at 1.23 Up 10.81%
Clickable Image
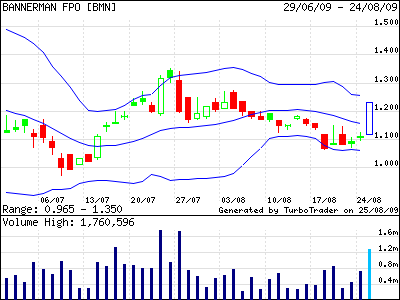
Click Chart To Enlarge
Chart Below Showing Cross-Over of
Buyers~~~~ over Sellers~~~~~
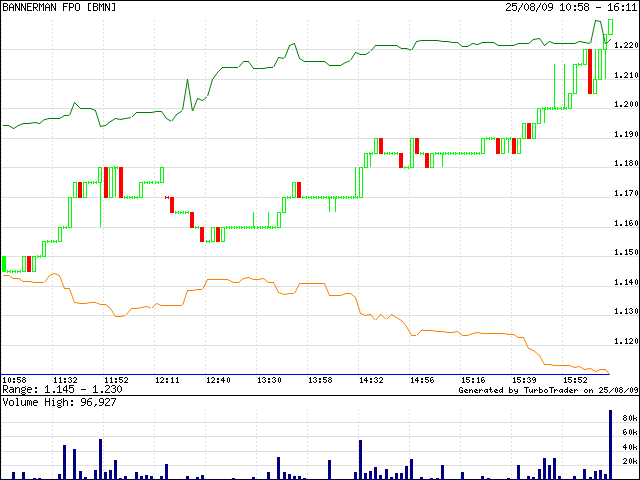
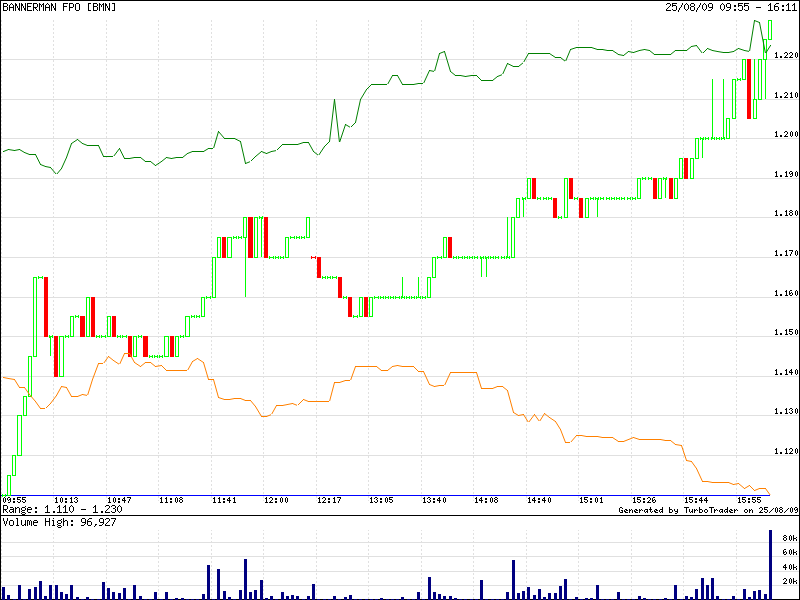
Bannerman Resources Limited(BMN)
Clickable Image
Volume: 1.260,991
No. of Trades: 405
Opening Price: 1.115
High Price: 1.23
Low Price: 1.115
Closed at 1.23 Up 10.81%
Clickable Image
Click Chart To Enlarge
Chart Below Showing Cross-Over of
Buyers~~~~ over Sellers~~~~~
________________________________________
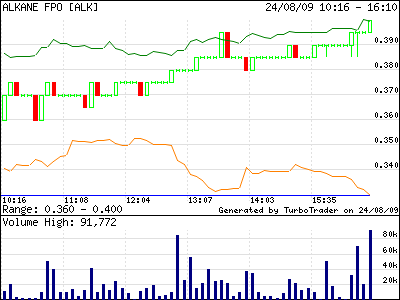
Monday 24th August 2009
Alkane Resources Limited (ALK)
Clickable Image

Volume: 1,369,506
No. of Trades: 132
Opening Price: 0.355
High Price: 0.40
Low Price: 0.355
Closed at 0.40 Up 21.21%
Clickable Image
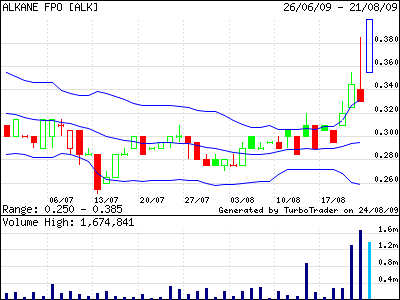
Chart Below Showing Cross-Over of
Buyers~~~~ over Sellers~~~~~
Clickable Image
Monday 24th August 2009
Alkane Resources Limited (ALK)
Clickable Image
Volume: 1,369,506
No. of Trades: 132
Opening Price: 0.355
High Price: 0.40
Low Price: 0.355
Closed at 0.40 Up 21.21%
Clickable Image
Chart Below Showing Cross-Over of
Buyers~~~~ over Sellers~~~~~
Clickable Image
____________________________________
To Visit My Other
Site Australian Uranium ASX Explorers
Quick Search A-Z
Please Click

____________________________________
accutane lawsuits
great blog keep up the good work
ReplyDelete