Over the coming Months I will be Including some Helpful Technical Analysis Topics to this site, To allow readers a better understanding of whats causes " Chart Breakouts " so as to better understand the Volatility Of the Markets, and in particular the Uranium Sector to which I am and this site is focused.
My first Topic of discussion will be Bollinger Bands, One of Traders most powerful tools for spotlighting extreme short-term price moves.
So What's a Bollinger Band?
Bollinger Bands consist of a center line and two price channels (bands) above and below it. The center line is an exponential moving average; the price channels are the standard deviations of the stock being studied. The bands will expand and contract as the price action of an issue becomes volatile (expansion) or becomes bound into a tight trading pattern (contraction).
Bollinger Bands are are especially useful for determining when a stock is overbought or oversold as they are an envelope that follows the simple 14-day moving average of the stock and can encompass a wider range of price movement. When the price is at or above the upper band, the stock may be overbought. Conversely a price at, or below, the lower band, indicates that the stock may be oversold.
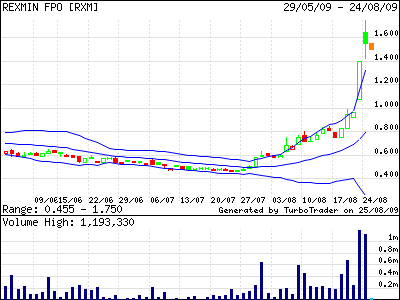
In Practice: Technical Analysts use Bollinger Bands to see how relatively high or low a stock is trading. When a stock gets close to the high or low band, an analyst will look for certain patterns, such as "double Bottoms" or "head and shoulders," which can indicate a stock is bottoming out or peaking. One is the double bottom, a classic bullish pattern. Another pattern to look for is called the "squeeze," where the Bollinger Bands contract and 'squeeze' the stock price, as can be seen in the chart below.
This represents a tightening in volatility and usually results in a release of pent-up price movement, typically to the upside, as was the case with Rex Minerals - RXM
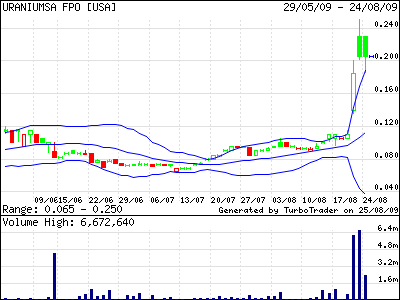
Here's another two Classic example's of Upper and Lower Bollinger squeeze in play just prior to "Breakout" this time its with Uraniumsa Limited - USA
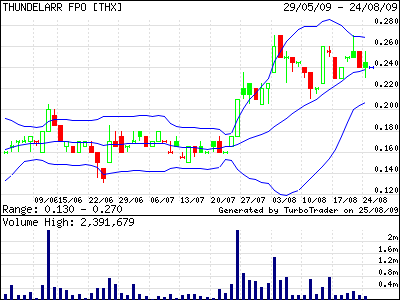
Thundelarra Exploration Limited - THX
Now Lets see If we can Spot a possible "Breakout" Contender !
Here's a Excellent chart example showing clearly to Bollinger squeeze that's currently in play on Northern Uranium NTU, & is definitely a stock to watch over the coming period as a "Breakout" is Imminent over the proceeding period.
My first Topic of discussion will be Bollinger Bands, One of Traders most powerful tools for spotlighting extreme short-term price moves.
So What's a Bollinger Band?
Bollinger Bands consist of a center line and two price channels (bands) above and below it. The center line is an exponential moving average; the price channels are the standard deviations of the stock being studied. The bands will expand and contract as the price action of an issue becomes volatile (expansion) or becomes bound into a tight trading pattern (contraction).
Bollinger Bands are are especially useful for determining when a stock is overbought or oversold as they are an envelope that follows the simple 14-day moving average of the stock and can encompass a wider range of price movement. When the price is at or above the upper band, the stock may be overbought. Conversely a price at, or below, the lower band, indicates that the stock may be oversold.
In Practice: Technical Analysts use Bollinger Bands to see how relatively high or low a stock is trading. When a stock gets close to the high or low band, an analyst will look for certain patterns, such as "double Bottoms" or "head and shoulders," which can indicate a stock is bottoming out or peaking. One is the double bottom, a classic bullish pattern. Another pattern to look for is called the "squeeze," where the Bollinger Bands contract and 'squeeze' the stock price, as can be seen in the chart below.
This represents a tightening in volatility and usually results in a release of pent-up price movement, typically to the upside, as was the case with Rex Minerals - RXM
Here's another two Classic example's of Upper and Lower Bollinger squeeze in play just prior to "Breakout" this time its with Uraniumsa Limited - USA
Thundelarra Exploration Limited - THX
Now Lets see If we can Spot a possible "Breakout" Contender !
Here's a Excellent chart example showing clearly to Bollinger squeeze that's currently in play on Northern Uranium NTU, & is definitely a stock to watch over the coming period as a "Breakout" is Imminent over the proceeding period.
Northern Uranium - NTU one to watch over the coming period

I'm hoping the above Information can assist Traders in timing that next "Breakout "Bollinger runner.
For A Full Listing Of Stocks With Uranium Exploration Exposure
Just Click Image Below !

No comments:
Post a Comment